Affinity propagation - step by step
This article will walk you through a step-by-step implementation of affinity propagation, a clustering algorithm by message passing by Frey and Dueck [@Frey:2007:Clustering].
Step-by-step
Input data
Given a similarity matrix
S = rbind(c(1.0, 0.8, 0.7, 0.2, 0.5),
          c(0.8, 1.0, 0.75, 0.3, 0.3),
          c(0.7, 0.75, 1., -0.1, 0.4),
          c(0.2, 0.3, -0.1, 1.0, 0.8),
          c(0.5, 0.3, 0.4, 0.8, 1.0)) %>%
    set_colnames(c('A', 'B', 'C', 'D', 'E')) %>%
    set_rownames(c('A', 'B', 'C', 'D', 'E'))
image(S, col = cm.colors(101))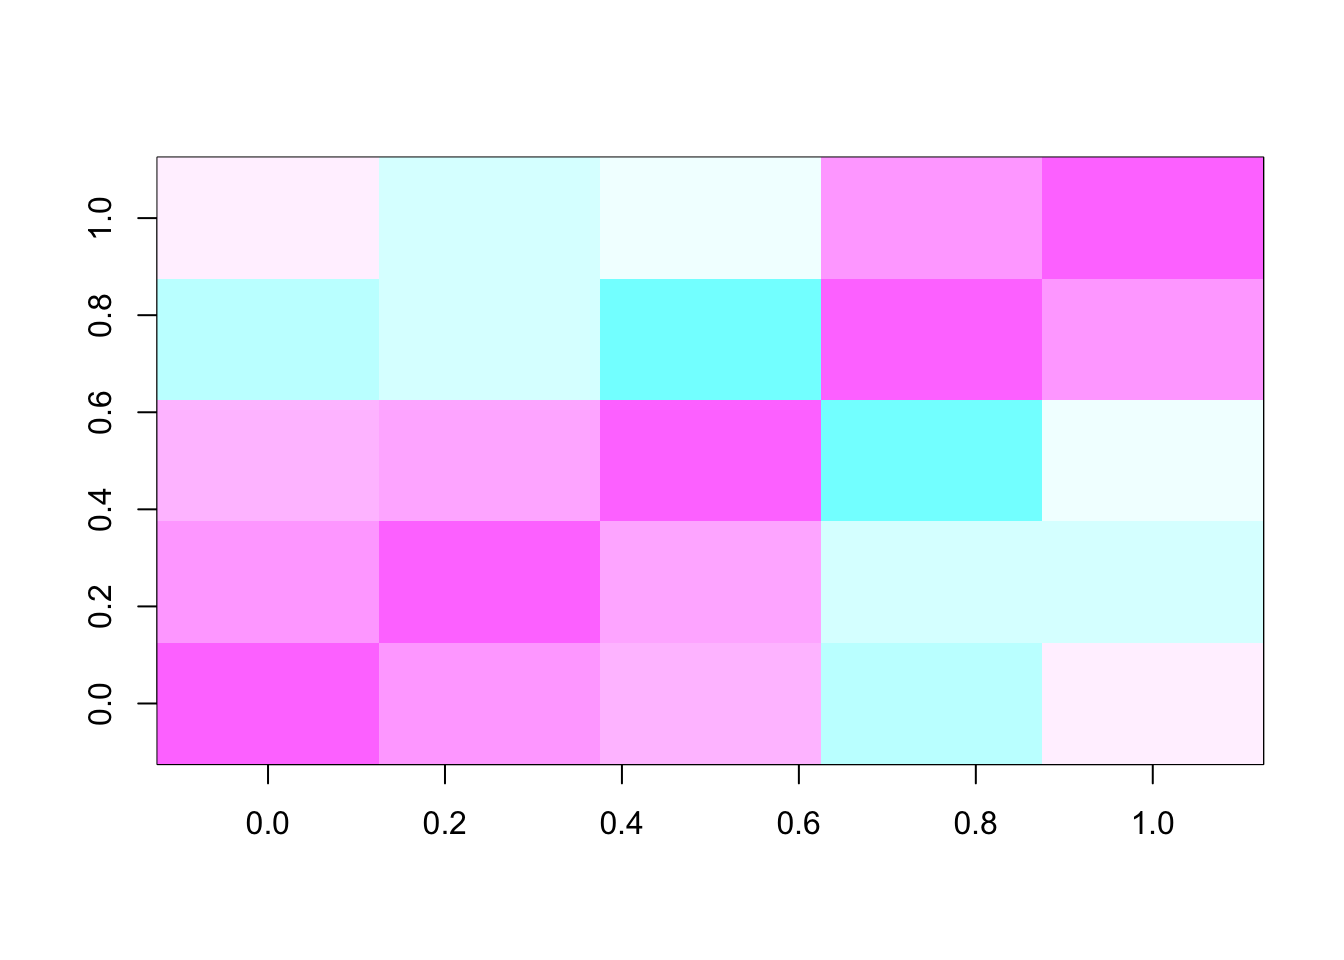
Initialize responsibility matrix \(R\) and availability matrix \(A\)
R = S
R[,] = 0
A = R
Updating rules
\[ \begin{align} r(i,k) &\leftarrow s(i,k) - \max_{k' \neq k} \{a(i,k') + s(i,k')\} \\ a(k,k) &\leftarrow \sum_{i' \neq k} \max \{ 0, r(i',k)\} \\ a(i,k) &\leftarrow \min \{ 0, r(k,k) + \sum \max_{i' \notin \{i,k\} } \{0, r(i', k)\} \end{align} \]
update <- function(s, r, a) {
    r_new = r
    a_new = a
    for (i in 1:nrow(s)) {
        for (k in 1:ncol(s)) {
            r_new[i,k] = s[i,k] - max((a[i,] + s[i,])[-k])
        }
    }

    # A must be updated using NEW R
    for (i in 1:nrow(s)) {
        for (k in 1:ncol(s)) {
            is.positive = r_new[,k] > 0
            is.included = rep(TRUE, nrow(s))
            if (i == k) {
                is.included[k] = FALSE
                a_new[k,k] = sum(r_new[is.positive & is.included,k])
            } else {
                is.included[c(i,k)] = FALSE
                sum_responsibility = sum(r_new[is.positive & is.included, k])
                a_new[i,k] = min(0,r_new[k,k] + sum_responsibility)
            }

        }
    }
    exemplars = diag(r_new) + diag(a_new)
    return(list('r'=r_new,
                'a'=a_new,
                'exemplars' = exemplars))
}
step1 = update(S, R, A)
step1$s## NULLstep1$r## A B C D E
## A 0.2 -0.20 -0.30 -0.8 -0.5
## B -0.2 0.20 -0.25 -0.7 -0.7
## C -0.3 -0.25 0.25 -1.1 -0.6
## D -0.8 -0.70 -1.10 0.2 -0.2
## E -0.5 -0.70 -0.60 -0.2 0.2step1$a## A B C D E
## A 0 0 0 0 0
## B 0 0 0 0 0
## C 0 0 0 0 0
## D 0 0 0 0 0
## E 0 0 0 0 0step1$r + step1$a## A B C D E
## A 0.2 -0.20 -0.30 -0.8 -0.5
## B -0.2 0.20 -0.25 -0.7 -0.7
## C -0.3 -0.25 0.25 -1.1 -0.6
## D -0.8 -0.70 -1.10 0.2 -0.2
## E -0.5 -0.70 -0.60 -0.2 0.2step1$exemplars## A B C D E
## 0.20 0.20 0.25 0.20 0.20Sb = S
diag(Sb) = 0
Sb## A B C D E
## A 0.0 0.80 0.70 0.2 0.5
## B 0.8 0.00 0.75 0.3 0.3
## C 0.7 0.75 0.00 -0.1 0.4
## D 0.2 0.30 -0.10 0.0 0.8
## E 0.5 0.30 0.40 0.8 0.0step1b = update(Sb, R, A)
step1b$r## A B C D E
## A -0.80 0.10 -0.10 -0.60 -0.30
## B 0.05 -0.80 -0.05 -0.50 -0.50
## C -0.05 0.05 -0.75 -0.85 -0.35
## D -0.60 -0.50 -0.90 -0.80 0.50
## E -0.30 -0.50 -0.40 0.30 -0.80step1b$a## A B C D E
## A 0.05 -0.75 -0.75 -0.5 -0.3
## B -0.80 0.15 -0.75 -0.5 -0.3
## C -0.75 -0.70 0.00 -0.5 -0.3
## D -0.75 -0.65 -0.75 0.3 -0.8
## E -0.75 -0.65 -0.75 -0.8 0.5step1b$exemplars## A B C D E
## -0.75 -0.65 -0.75 -0.50 -0.30Complete implementation
run_apcluster <- function(S, preference = 0, maxiter = 200, lam = 0.5, keep_intermediates = FALSE) {
    Sb = S
    diag(Sb) = preference
    Rb = Sb
    Ab = Sb
    Rb[,] = 0
    Ab[,] = 0
    intermediates = list()
    for (i in 1:maxiter) {
        step_i = update(Sb, Rb, Ab)
        Rb = (1-lam) * step_i$r + lam*Rb
        Ab = (1-lam) * step_i$a + lam*Ab
        if (keep_intermediates) {
            intermediates[[i]] = step_i$exemplars
        }
    }
    assignment = apply(step_i$r + step_i$a, 1, function(x) { return(which.max(x))})
    return(list('result' = assignment, 'intermediates' = intermediates))
}
ap_130 = run_apcluster(S = S, preference = 0, lam = 0., maxiter = 130, keep_intermediates = TRUE)
do.call(cbind,ap_130$intermediates) %>%
reshape2::melt() %>%
set_names(c('point', 'iter', 'examplarity')) %>%
ggplot() +
geom_line(aes(x=iter,y=examplarity,group=point, color =point)) +
# facet_grid(point ~ .) +
ggtitle('damping = 0, preference = 0')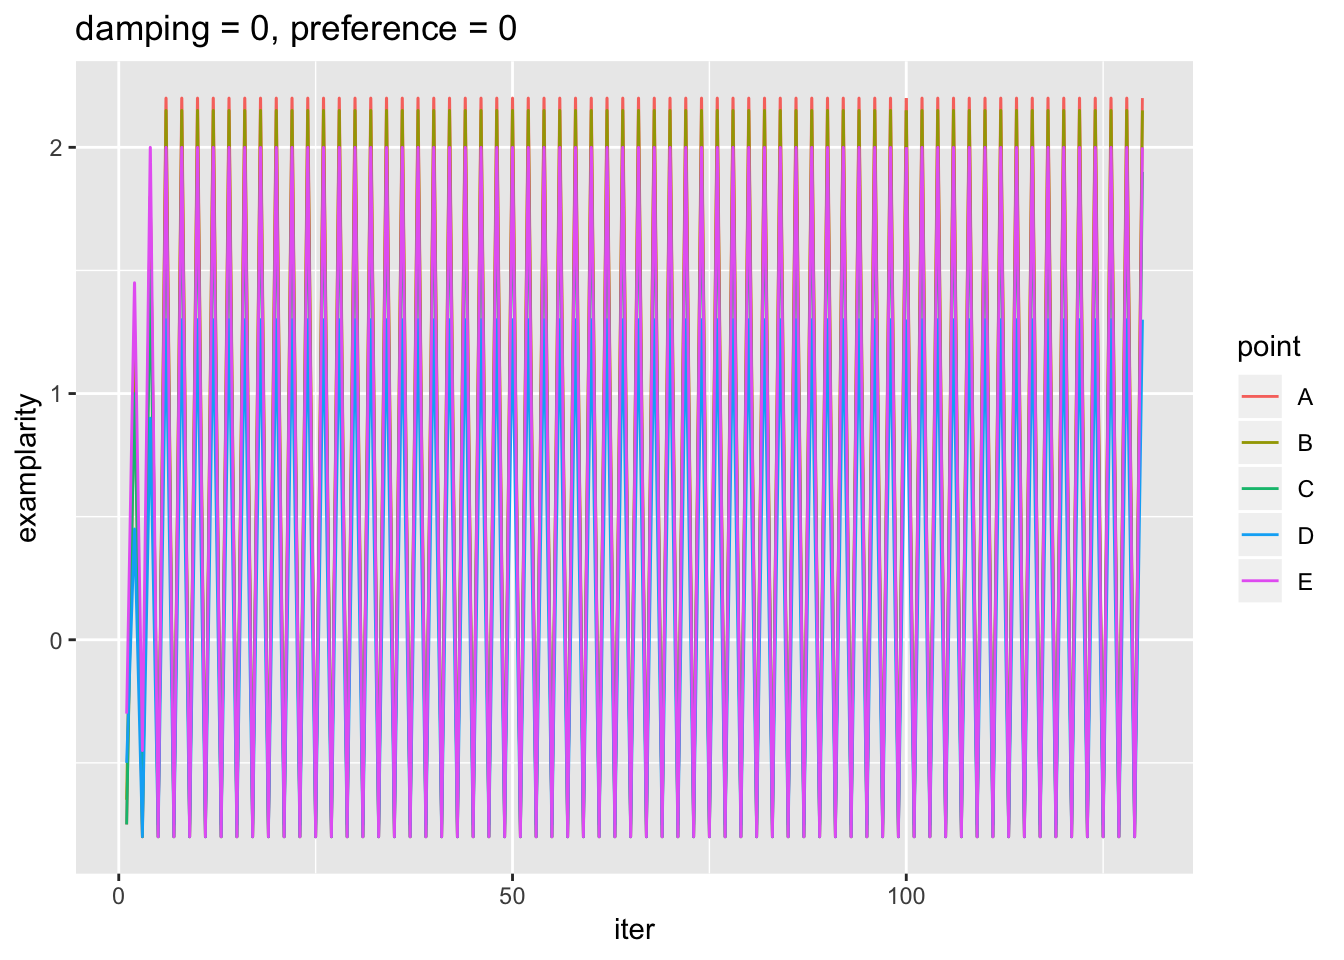
ap_130 = run_apcluster(S = S, preference = 0, lam = 0.5, maxiter = 130, keep_intermediates = TRUE)
do.call(cbind,ap_130$intermediates) %>%
    reshape2::melt() %>%
    set_names(c('point', 'iter', 'examplarity')) %>%
    ggplot() +
        geom_line(aes(x=iter,y=examplarity,group=point, color =point)) +
        # facet_grid(point ~ .) +
        ggtitle('damping = 0.5, preference = 0')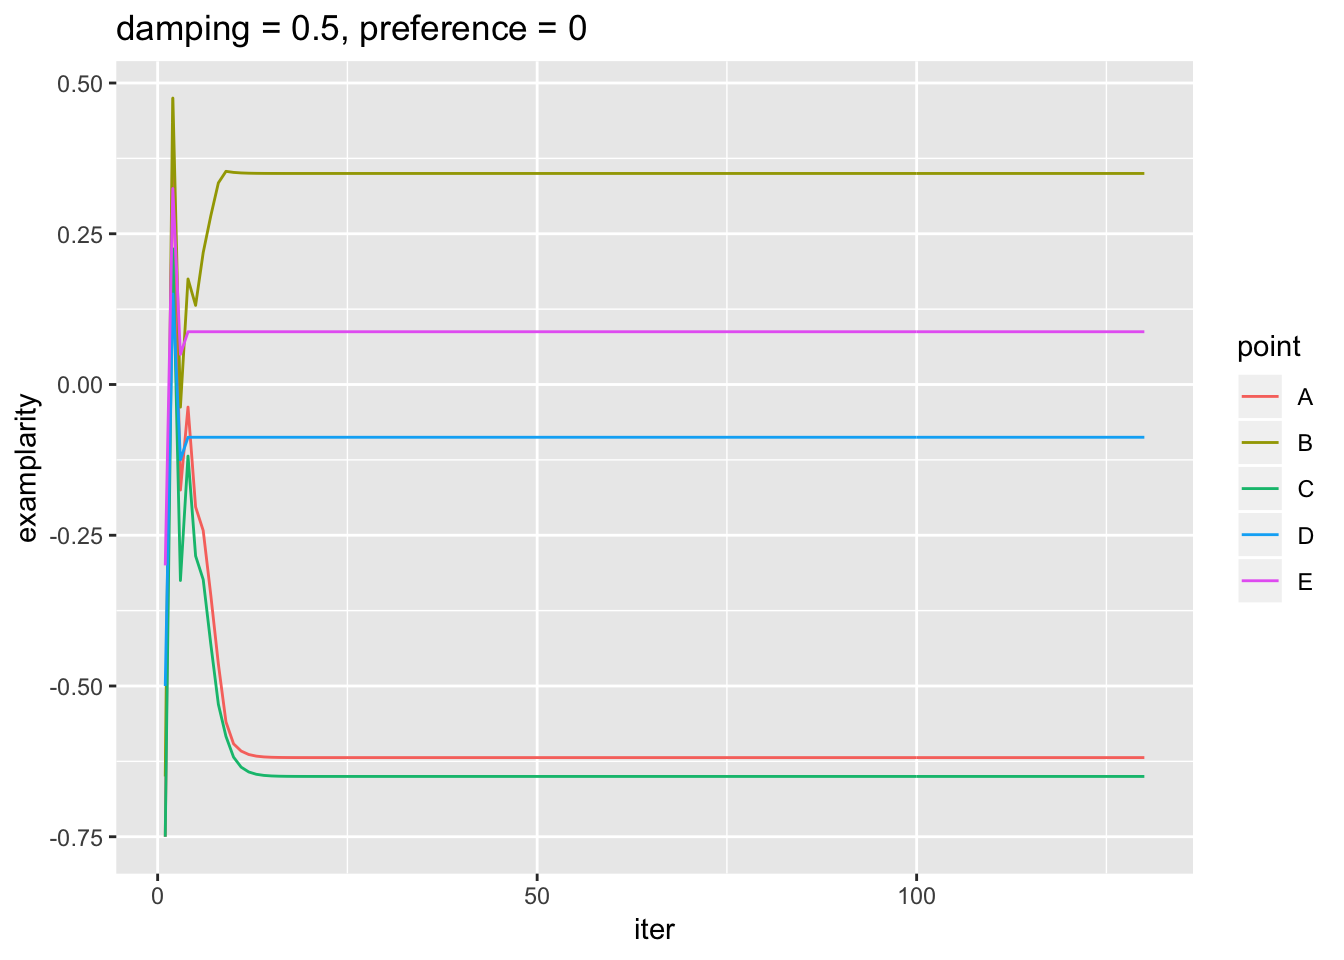
Cluster assignment
ap_130$result## A B C D E
## 2 2 2 5 5
